
Explore the Cardiac Cycle & Wiggers Diagram Lab
Drive the heart through atrial systole, ventricular systole and diastole, watch the valves open and close, and read a real Wiggers-style pressure graph.
- Free to use
- No signup
- Nothing to install
- Runs in your browser
Illustration. Open the tool for the real thing.
See it in action
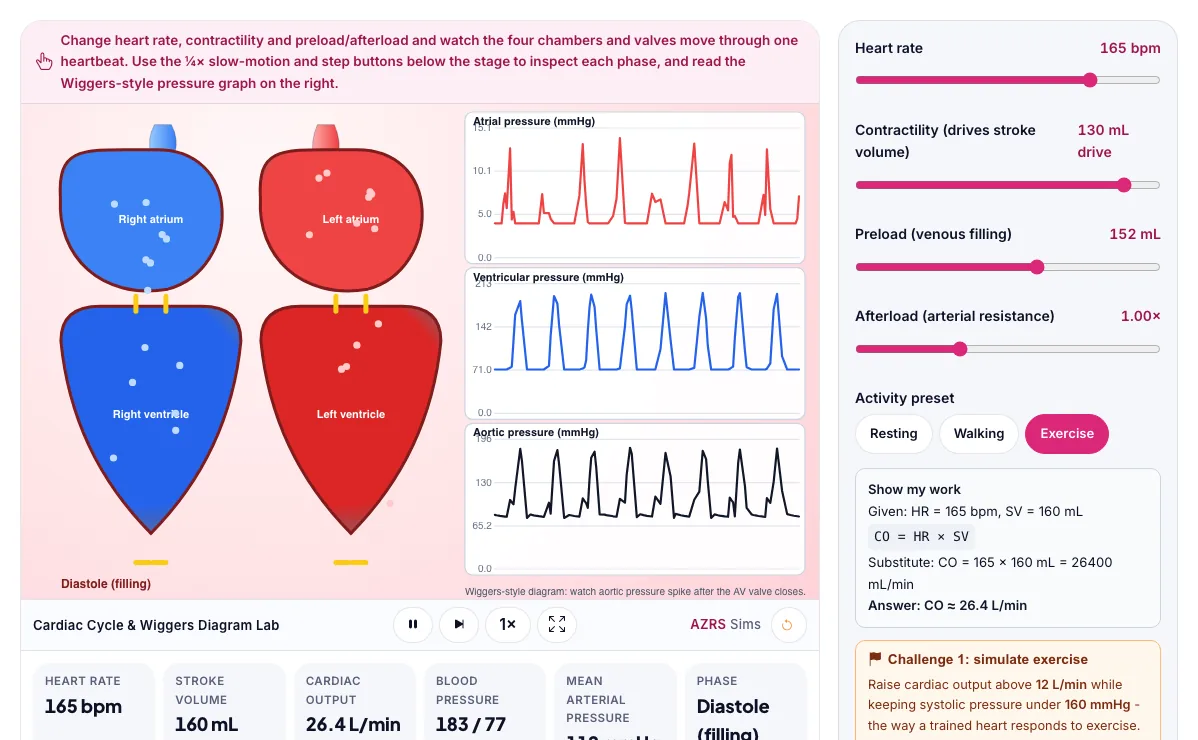
The Cardiac Cycle & Wiggers Diagram Lab with sample data entered and the result showing.
What is the Cardiac Cycle & Wiggers Diagram Lab?
Drive the heart through atrial systole, ventricular systole and diastole, watch the valves open and close, and read a real Wiggers-style pressure graph. It runs in your browser, so a change to a setting or a drag on an object shows up at once.
Cardiologists read pressure-volume relationships like this to diagnose valve disease and heart failure, and exercise physiologists use cardiac output to judge fitness.
3 steps to your result
Open the tool and follow along. Nothing to install.
What you get
Cardiac output = heart rate × stroke volume.
The AV valves close when ventricular pressure exceeds atrial pressure; the semilunar valves open when it exceeds arterial pressure.
More venous filling (preload) raises stroke volume (Frank-Starling law); more arterial resistance (afterload) lowers it.
Switch to the Exercise preset and watch cardiac output climb.
Raise afterload and see stroke volume fall even though heart rate is unchanged.
Use the ¼× slow-motion button to watch exactly when each valve opens and closes.
Used for
Pick one to see how it fits.
Biology learners
Biology students and teachers who want to explore living systems, populations and genetics interactively and safely.
Try it freeTeachers
For teachers: project the Cardiac Cycle & Wiggers Diagram Lab on the board, let students predict the result, then run it together and test this: Raise afterload and see stroke volume fall even though heart rate is unchanged. For students: change one thing at a time and write down what changes.
Try it freeHow it compares
A plain look at this tool next to the usual alternative.
| This simulation | Textbook diagram | |
|---|---|---|
| Interactive | Drag, tap and change settings | Fixed picture |
| Install | Nothing to install | Not needed |
| Cost | Free to use | Depends on the book |
Questions people ask
What is cardiac output?
The volume of blood the heart pumps per minute: heart rate multiplied by stroke volume.
Why does the aortic pressure trace show a small notch (dicrotic notch)?
It marks the aortic valve snapping shut once ventricular pressure falls below aortic pressure, briefly bouncing the pressure.
Is the Cardiac Cycle & Wiggers Diagram Lab free to use?
Yes. The Cardiac Cycle & Wiggers Diagram Lab is free, needs no signup or download and runs in your web browser. It is part of the Biology group of AZRS simulations.
Does the Cardiac Cycle & Wiggers Diagram Lab work on a phone or tablet?
Yes. The Cardiac Cycle & Wiggers Diagram Lab takes touch input as well as mouse input, so you can use its 5 adjustable settings with a finger. A larger screen makes the controls and graphs easier to read.
How do I use the Cardiac Cycle & Wiggers Diagram Lab?
1. In the Cardiac Cycle & Wiggers Diagram Lab, use the controls to change Heart rate, Contractility (drives stroke volume), Preload (venous filling), Afterload (arterial resistance), Activity preset. The simulation reacts instantly. 2. In the Cardiac Cycle & Wiggers Diagram Lab, pick an option such as Resting, Walking, Exercise to switch modes or load an example. 3. In the Cardiac Cycle & Wiggers Diagram Lab, press "Check my heart", "Check athlete heart" to start, reset or change what is happening. 4. Start with this experiment: Switch to the Exercise preset and watch cardiac output climb. Drag any glowing handle, object or slider with your mouse or finger and the Cardiac Cycle & Wiggers Diagram Lab responds in real time. 5. Change one setting at a time and watch which readout moves, then compare it with this idea: Cardiac output = heart rate × stroke volume.
More free tools
Related to the Cardiac Cycle & Wiggers Diagram Lab.
Try the Cardiac Cycle & Wiggers Diagram Lab now
Drive the heart through atrial systole, ventricular systole and diastole, watch the. Free to use.
Try it free