Website Speed Test
Test page load time, server response and page size for mobile or desktop.
Why Test Your Website Speed?
Fast websites rank better and convert more visitors
Real Load Times
Measure actual page load times from real servers. No simulations - get accurate performance data you can trust.
TTFB Analysis
Check Time to First Byte (TTFB) to identify server response issues and optimize backend performance.
Performance Score
Get an overall performance score and understand how your site compares to industry standards.
Mobile & Desktop
Test on both mobile and desktop devices. Ensure fast loading times across all user devices.
Resource Analysis
Identify large files, slow scripts, and heavy resources that are slowing down your site.
Optimization Tips
Get actionable recommendations to improve load times and deliver better user experiences.
How to Use This Tool Effectively
Actionable SEO advice to get the most out of every analysis
Start With Your Competitors
Run your top 3 competitors through this tool first. Understanding their structure, keywords, and technical issues reveals exactly where you can outrank them.
Run Monthly Audits
SEO is not a one-time task. Schedule monthly checks to catch new issues before Google penalizes them. Consistent analysis beats one big yearly audit every time.
Fix High-Impact Issues First
Not all errors are equal. Prioritize: broken crawl paths → missing meta titles → slow load times → thin content. This order maximizes ranking gains per hour spent.
Internal Links Are Free PageRank
Every internal link passes authority between your pages. Use the Internal Link Finder to ensure your most important pages receive the most internal links.
Page Speed Directly Affects Rankings
Google's Core Web Vitals are a confirmed ranking factor. Pages loading under 2.5 seconds see significantly higher rankings and 40% lower bounce rates than slow pages.
Keep Your Sitemap Clean
Your sitemap tells Google what to index. Remove redirect chains, 404s, and noindex pages from it. A clean sitemap = faster, more complete indexation of good content.
More Free SEO Tools
Everything you need to dominate search rankings — all free, no signup required
🔍 SEO & Website Analysis
🧮 Free Calculators
⚙️ Developer & Utility Tools
How to use the Website Speed Test
- Enter the full page URL including https://.
- Choose Mobile or Desktop.
- Press Test Speed Now, or use one of the example sites.
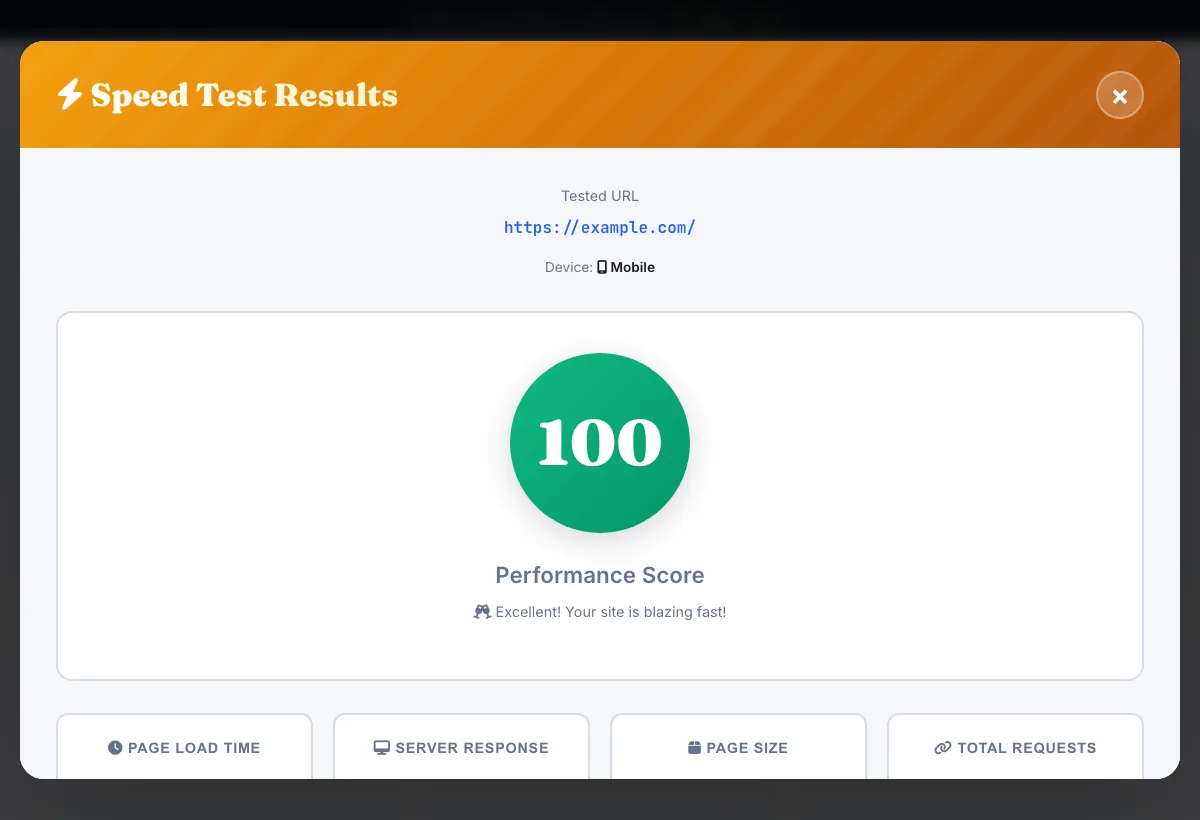
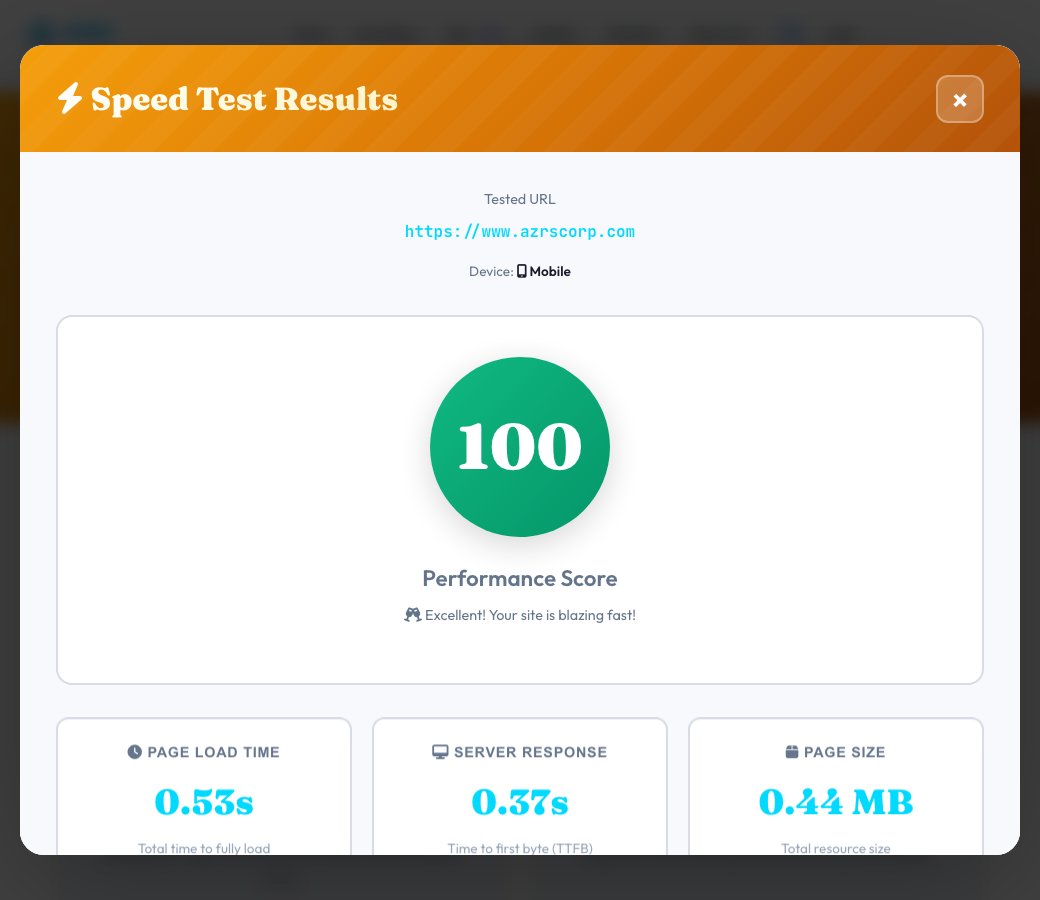
- Read the performance score, page load time, server response (TTFB), page size and number of requests.
- Work through the optimisation recommendations, then test again.
Example
URL: https://example.com   Device: Mobile
Page load time: 2.4 s
Server response (TTFB): 0.6 s
Page size: 1.8 MB   Requests: 54

Heavy images and many requests are the usual causes. Compress images, defer scripts and retest.
Tips for better results
- Test your slowest template, not only the home page.
- Run it a few times and compare.
- Fix server response first if TTFB is high.
Common mistakes
- Trusting a single run.
- Optimising only the home page.
- Adding more scripts while trying to speed things up.
Frequently asked questions
What is TTFB?
Time to first byte: how long the server takes to start responding. High values often point to slow hosting or backend work.
Why do results vary between runs?
Network conditions, caching and server load change each time, so compare several runs.
What is a good load time?
Under about 2.5 seconds is a common goal for key pages.
What reduces page size?
Compress and resize images, remove unused scripts and enable text compression.
Does the device setting matter?
Yes, mobile tests approximate slower conditions, which is how most visitors browse.
See Free Website Speed Test in action
Free Website Speed Test
Enter any URL and this tool fetches it live, timing the full response, measuring Time to First Byte (TTFB), total page size and counting requests (images, scripts, stylesheets), then converts those into a 0-100 performance score with specific recommendations — the same core metrics a real visitor's browser experiences.
It's a real HTTP request against the live page, not a cached or simulated score: slow server response, oversized pages and too many render-blocking resources all show up directly in the numbers, with plain-language fixes underneath.
Use it in 4 steps
Enter the URL you want to test.
Choose desktop or mobile.
Run the test and wait a few seconds for the live fetch to complete.
Review your score, load time, TTFB, page size and the resource breakdown, then work through the recommendations.
Key features
Real load time & TTFB
Measures actual response time and server Time to First Byte for the URL you enter.
Resource breakdown
Counts HTML, images, JavaScript, CSS and font requests separately so you know exactly what's heavy.
0-100 performance score
A single score, penalized for slow load time and large page size, to track progress over time.
Actionable recommendations
Specific fixes like enabling compression, image optimization and caching, not generic advice.
A real example, step by step
Testing a page that loads in 1.8s with a 1.2MB page size and 42 requests returns a strong score with recommendations to convert images to WebP and enable GZIP compression for the next gain.
Who uses this tool
Site owners tracking performance
Re-run after every change to confirm load time actually improved, not just assumed.
Developers debugging slow pages
See TTFB separately from total load time to know if the bottleneck is the server or the front end.
Anyone comparing pages
Test a few key pages (homepage, top landing page, checkout) to find the slowest ones first.
Tips for the best results
- Test the exact URL visitors land on, not just your homepage — landing pages often carry more weight from ads or tracking scripts.
- A high TTFB usually points to server or hosting issues; a high total load time with low TTFB usually points to heavy front-end assets.
- Re-test a few times — network conditions vary, and one slow reading isn't necessarily your baseline.
- Fix the recommendations in order of impact: compression and image optimization typically move the score the most.
Common mistakes to avoid
- Only testing your homepage and assuming every page performs the same.
- Confusing TTFB (server response) with total load time (everything, including images and scripts).
- Ignoring mobile performance — many sites score noticeably worse on mobile despite the number people actually seeing at checkout.
Frequently asked questions
What is a good load time?
Under 2 seconds is considered good, under 1 second is excellent; Google's Core Web Vitals target Largest Contentful Paint under 2.5 seconds.
What is TTFB?
Time to First Byte — the delay between the request being sent and the first byte of the response arriving; under 200ms is considered ideal.
How is the performance score calculated?
It starts at 100 and is reduced for slow load time and large page size, giving a quick single number to track over time.
Does it test mobile and desktop separately?
Yes, choose the device before running the test since mobile results can differ meaningfully from desktop.
Is my data stored?
Test results are saved so you can see your test count and history; no login is required to run a test.
Is this free?
Yes, completely free with no signup required.
Free, fast and private by design
No signup, no watermark. New AZRS tools are added every week.