
Explore the Derivative Visualizer
Drag a point along a curve and see the tangent line and the derivative graph appear. Free, no signup, runs in your browser.
- Free to use
- No signup
- Nothing to install
- Runs in your browser
Illustration. Open the tool for the real thing.
See it in action
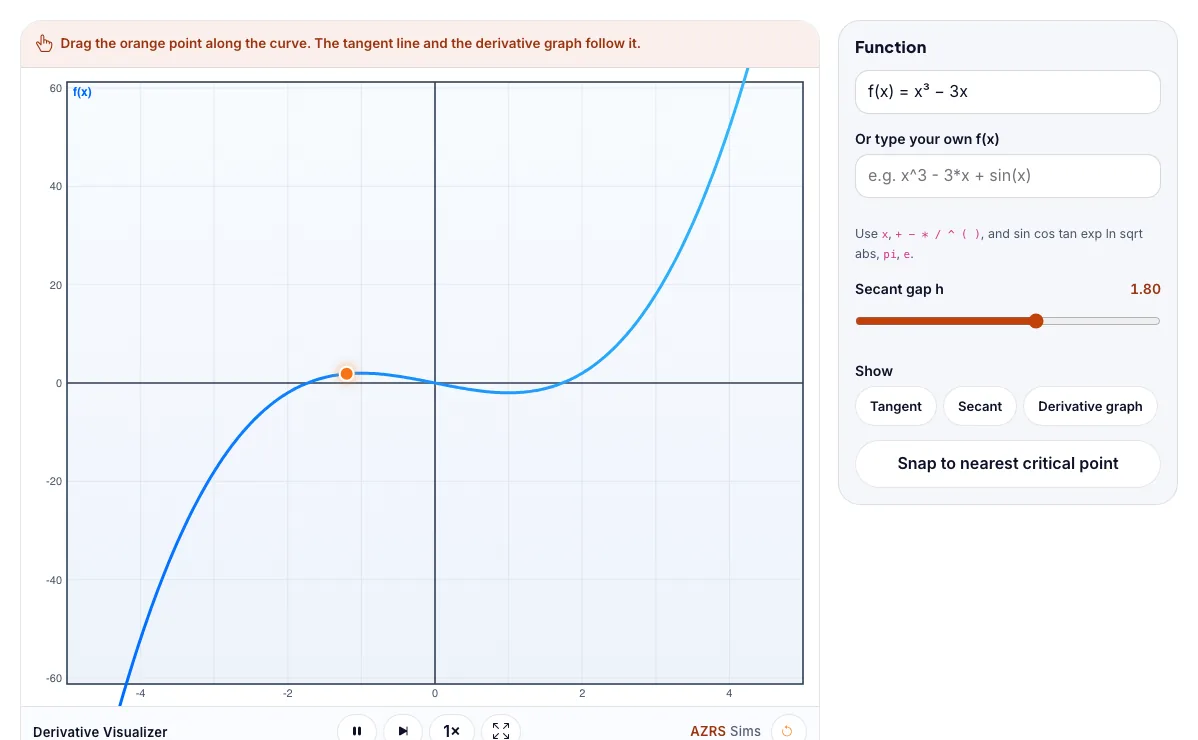
The Derivative Visualizer with sample data entered and the result showing.
What is the Derivative Visualizer?
Drag a point along a curve and see the tangent line and the derivative graph appear. It runs in your browser, so a change to a setting or a drag on an object shows up at once.
Derivatives measure rates of change in physics, economics, biology and machine learning, from speed to growth rates to optimisation.
3 steps to your result
Open the tool and follow along. Nothing to install.
What you get
The derivative at a point is the slope of the tangent line there.
Where the function has a peak or dip, the derivative is zero.
Increasing functions have a positive derivative, decreasing ones negative.
Drag the point to the top of a hill. What is the slope?
Pick sin(x) and compare with its derivative curve.
Shrink the secant gap h and watch the secant become the tangent.
Used for
Pick one to see how it fits.
Math learners
Algebra, geometry, trigonometry and calculus students, teachers preparing demonstrations, and self-learners who want to see the maths move.
Try it freeTeachers
For teachers: project the Derivative Visualizer on the board, let students predict the result, then run it together and test this: Pick sin(x) and compare with its derivative curve. For students: change one thing at a time and write down what changes.
Try it freeHow it compares
A plain look at this tool next to the usual alternative.
| This simulation | Textbook diagram | |
|---|---|---|
| Interactive | Drag, tap and change settings | Fixed picture |
| Install | Nothing to install | Not needed |
| Cost | Free to use | Depends on the book |
Questions people ask
What is the derivative geometrically?
The slope of the tangent line to the curve at a point, which is the instantaneous rate of change.
Why is the derivative zero at a maximum?
At the very top the curve is momentarily flat, so its tangent is horizontal and the slope is zero.
Is the Derivative Visualizer free to use?
Yes. The Derivative Visualizer is free, needs no signup or download and runs in your web browser. It is part of the Math group of AZRS simulations.
Does the Derivative Visualizer work on a phone or tablet?
Yes. The Derivative Visualizer takes touch input as well as mouse input, so you can use its 2 adjustable settings with a finger. A larger screen makes the controls and graphs easier to read.
How do I use the Derivative Visualizer?
1. In the Derivative Visualizer, use the controls to change Or type your own f(x), Secant gap h. The simulation reacts instantly. 2. In the Derivative Visualizer, pick an option such as Tangent, Secant, Derivative graph to switch modes or load an example. 3. In the Derivative Visualizer, press "Snap to nearest critical point" to start, reset or change what is happening. 4. Start with this experiment: Drag the point to the top of a hill. What is the slope?. Drag any glowing handle, object or slider with your mouse or finger and the Derivative Visualizer responds in real time. 5. Change one setting at a time and watch which readout moves, then compare it with this idea: The derivative at a point is the slope of the tangent line there.
More free tools
Related to the Derivative Visualizer.
Try the Derivative Visualizer now
Drag a point along a curve and see the tangent line and the derivative graph appear. Free to use.
Try it free