
Explore the Logistic Growth & Carrying Capacity Lab
Run the real logistic growth equation, add a harvesting rate, and find the maximum sustainable yield or push a population to collapse.
- Free to use
- No signup
- Nothing to install
- Runs in your browser
Illustration. Open the tool for the real thing.
See it in action
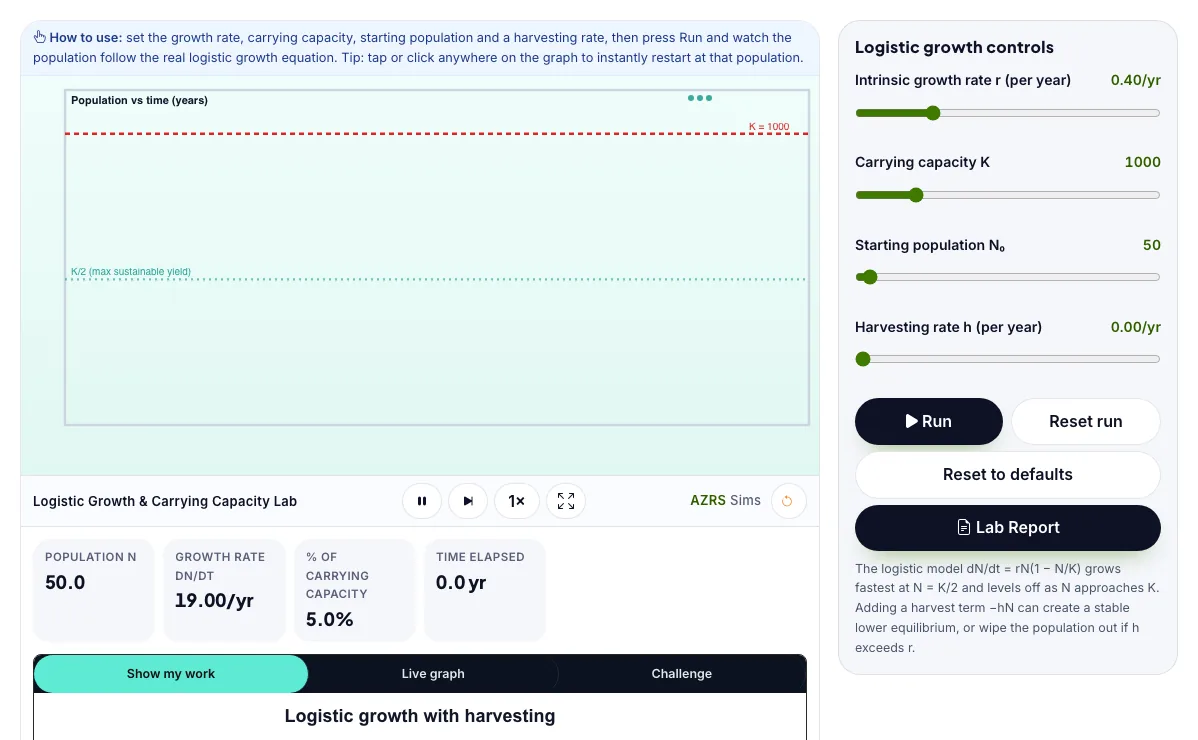
The Logistic Growth & Carrying Capacity Lab with sample data entered and the result showing.
What is the Logistic Growth & Carrying Capacity Lab?
Run the real logistic growth equation, add a harvesting rate, and find the maximum sustainable yield or push a population to collapse. It runs in your browser, so a change to a setting or a drag on an object shows up at once.
Fisheries and wildlife managers set catch and hunting quotas using exactly this maximum-sustainable-yield logic from the logistic growth model to avoid collapsing the populations they depend on.
3 steps to your result
Open the tool and follow along. Nothing to install.
What you get
The logistic growth equation dN/dt = rN(1 − N/K) starts nearly exponential at low population, grows fastest at N = K/2, and levels off as N approaches the carrying capacity K.
Adding a constant-rate harvest term, dN/dt = rN(1 − N/K) − hN, shifts the stable equilibrium down to N* = K(1 − h/r).
The maximum sustainable yield is taken at N = K/2, where the population's own natural growth rate is at its peak (rK/4) - harvesting there removes the most individuals without shrinking the population over time.
Run the model with no harvesting and watch the classic S-shaped logistic curve.
Set h to exactly r/2 and watch the population settle at K/2.
Push h just above r and watch a previously stable population collapse.
Used for
Pick one to see how it fits.
Environmental Science learners
Students, teachers and curious learners of all ages.
Try it freeTeachers
For teachers: project the Logistic Growth & Carrying Capacity Lab on the board, let students predict the result, then run it together and test this: Set h to exactly r/2 and watch the population settle at K/2. For students: change one thing at a time and write down what changes.
Try it freeHow it compares
A plain look at this tool next to the usual alternative.
| This simulation | Textbook diagram | |
|---|---|---|
| Interactive | Drag, tap and change settings | Fixed picture |
| Install | Nothing to install | Not needed |
| Cost | Free to use | Depends on the book |
Questions people ask
Why is N = K/2, not N = K, the best population level to harvest at?
The logistic curve's own growth rate rN(1−N/K) is a downward parabola in N that peaks exactly at N = K/2; harvesting there lets you remove the largest possible amount each year while the remaining population still regrows to replace it, whereas near K the population is barely growing at all.
What happens if a fishery sets its harvest rate higher than the fish population's intrinsic growth rate?
Mathematically the only stable equilibrium becomes N = 0: the harvest term hN removes fish faster than reproduction rN(1−N/K) can ever replace them at any population size, so the stock is driven toward collapse regardless of the starting population.
Is the Logistic Growth & Carrying Capacity Lab free to use?
Yes. The Logistic Growth & Carrying Capacity Lab is free, needs no signup or download and runs in your web browser. It is part of the Environmental Science group of AZRS simulations.
Does the Logistic Growth & Carrying Capacity Lab work on a phone or tablet?
Yes. The Logistic Growth & Carrying Capacity Lab takes touch input as well as mouse input, so you can use its 4 adjustable settings with a finger. A larger screen makes the controls and graphs easier to read.
How do I use the Logistic Growth & Carrying Capacity Lab?
1. In the Logistic Growth & Carrying Capacity Lab, use the controls to change Intrinsic growth rate r (per year), Carrying capacity K, Starting population N₀, Harvesting rate h (per year). The simulation reacts instantly. 2. In the Logistic Growth & Carrying Capacity Lab, press "▶ Run", "Reset run" to start, reset or change what is happening. 3. Start with this experiment: Run the model with no harvesting and watch the classic S-shaped logistic curve. Drag any glowing handle, object or slider with your mouse or finger and the Logistic Growth & Carrying Capacity Lab responds in real time. 4. Change one setting at a time and watch which readout moves, then compare it with this idea: The logistic growth equation dN/dt = rN(1 − N/K) starts nearly exponential at low population, grows fastest at N = K/2, and levels off as N approaches the carrying capacity K.
More free tools
Related to the Logistic Growth & Carrying Capacity Lab.
Try the Logistic Growth & Carrying Capacity Lab now
Run the real logistic growth equation, add a harvesting rate, and find the maximum. Free to use.
Try it free